Get started
Still unsure of the impact of Sonik?
See it for yourself and ask for your free trial


Of all the numbers a dialer dashboard shows you, only a handful move before pipeline moves: connect rate by slot and persona, conversation rate, meeting rate per conversation, callbacks and meetings held. Dials, average call duration and monthly averages do not predict anything. Here are the 12 call stats we would keep, grouped by what they predict, with benchmark values from our analysis of 1,000,000 B2B cold calls in France.
A metric predicts pipeline if it changes two to four weeks before the number of qualified opportunities changes, in the same direction, for a reason you can act on. That rules out most of what dialers report by default. Total dials go up when a rep is anxious; they go down when a rep is doing discovery. Neither tells you anything about next month.
The 12 metrics below pass that test in our experience. We group them in three layers: reach, conversation, outcome.
Connects divided by dials, with gatekeepers and wrong numbers excluded. French B2B average: 11.3%. Range 11-20% depending on persona and time slot. Averages differ by market and persona, which is why you should benchmark locally.
This is the one most teams never split. In our data 4pm connects at 15.8%, 10am at 14%, 8am at 9.8%. A rep who dials from 8 to 10 every morning is working 40% harder than one who dials at 4pm, for the same connects. Read the 8am slot and you can predict next month's conversations.
Founders pick up more around 10am, marketing around 4pm, HR around 1pm. Sales and leadership answer above 15% overall. When a team's connect rate drops, this split tells you whether the list changed persona or the reps changed hours.
In our experience, most connects happen within the first three attempts. Track the distribution of attempts, not the average. A pile of contacts on attempt one predicts connects you have not collected yet; a pile on attempt six predicts a burnt list.
Connects that get past the opener with the target persona, divided by connects. This is where 65% of reps lose, because they open by explaining what they sell. We treat anything under 60% of connects as an opener problem, not a list problem.
The share of conversations opened on a trigger rather than a pitch. Trigger-based openers reach a 7-10% meeting rate versus 2-3% pitch-first. Move the mix by 20 points and you can calculate the meeting change before it happens.
Count questions starting with "how" per conversation. Those questions lift conversion by 190% in our data. Pair it with one objection metric: reps who ask "What do you mean?" before answering convert 197% better. Both are visible in a transcript, neither in a call log.
Not the average. The share of conversations under 60 seconds predicts hang-ups; the share over 6 minutes predicts meetings. The average blends both and predicts nothing.
Meetings booked divided by conversations. The single best predictor of next month's pipeline per rep. Benchmark: 2-3% pitch-first, 7-10% trigger-based.
Prospects who call back after a missed attempt or a voicemail. A number that is called back is a number with a working reputation and a relevant message. In our experience a rising callback rate is the earliest sign that a new opener is working, before meetings show it.
Held divided by booked. The honest version of meeting rate. Above 70% in our experience; teams that confirm the day before run above 80%.
Euros of qualified pipeline created divided by conversations held. This is the metric to compare two reps with equal dials and different results, and the one to use when deciding whether a list or a persona deserves more calling time.
Sonik's dashboard was built after we had the 1,000,000-call dataset, which shaped which numbers we show first. Conversations per day leads, because it is the number parallel dialing moves (about 5x more conversations per rep). Connect rate is always split by slot and persona, never shown as one average.
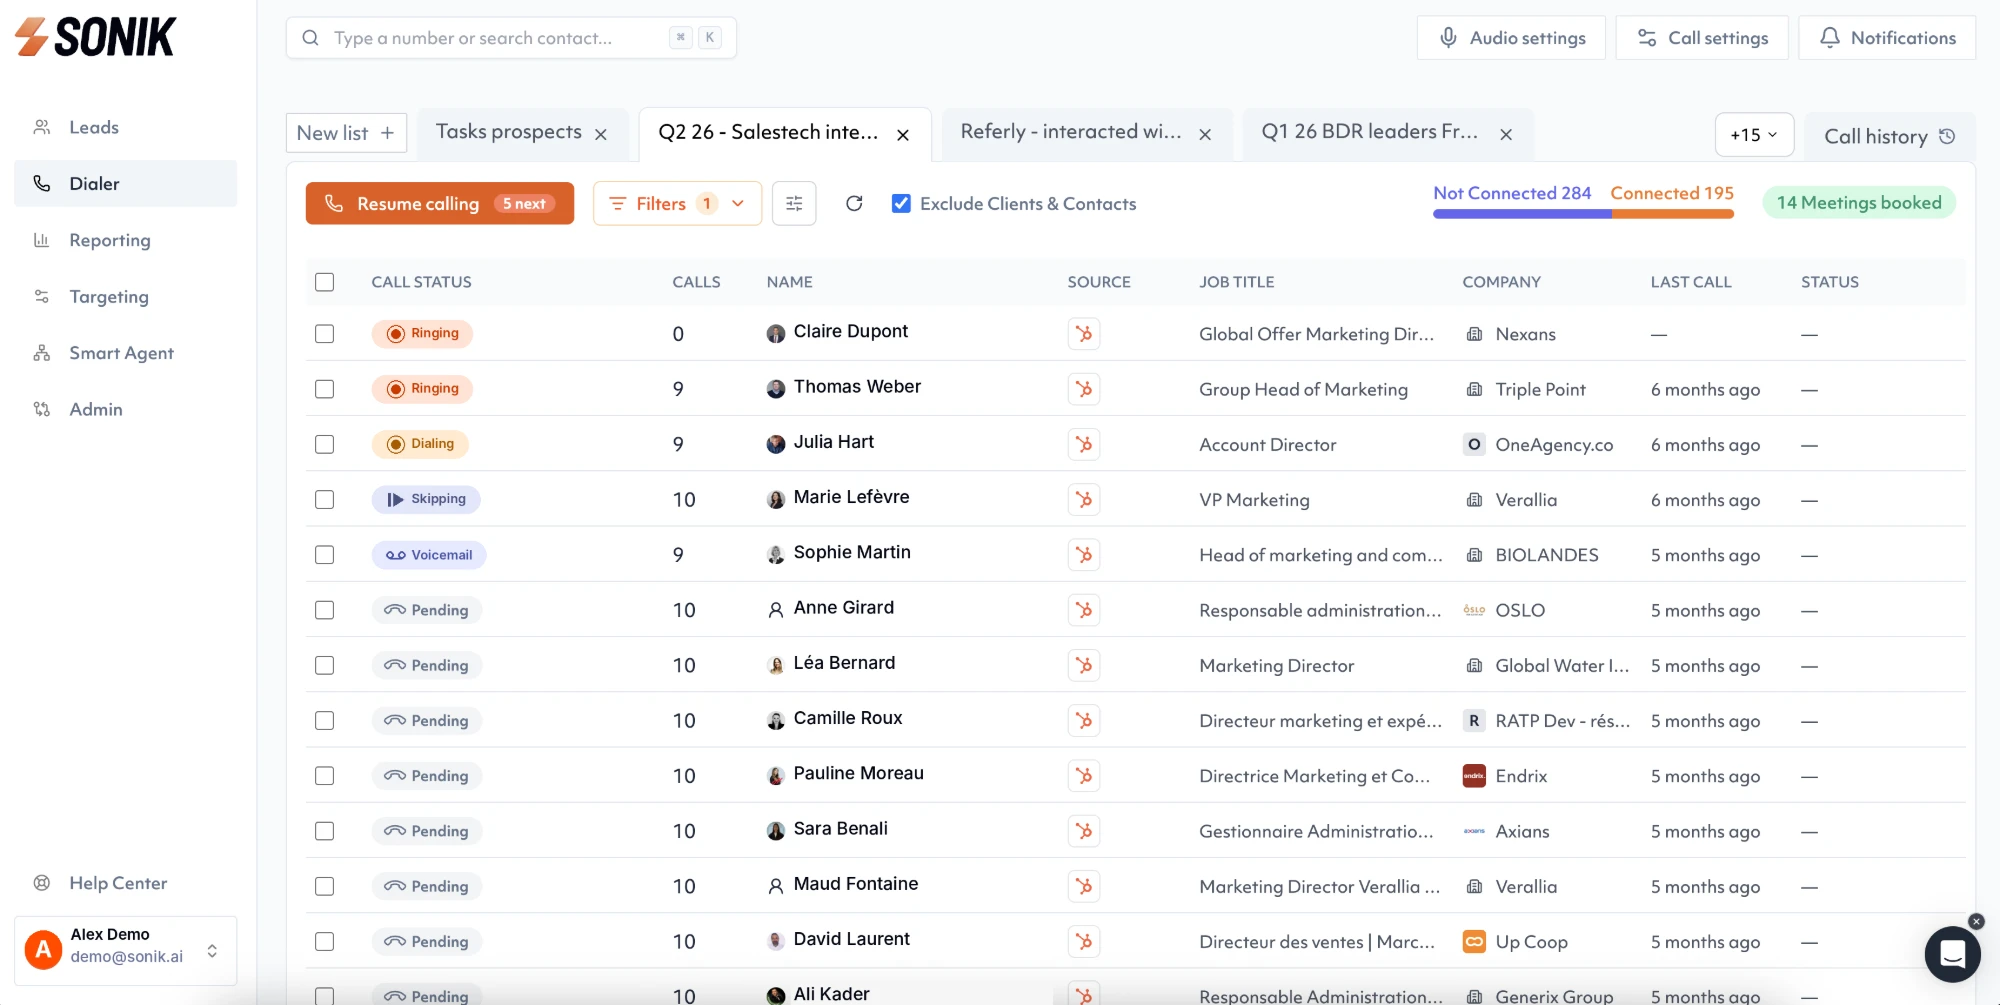
The conversation layer comes from AI call summaries: opener type, discovery questions, objections raised and how they were handled. That makes metrics 5 to 8 visible for every call rather than for the three calls a manager has time to listen to.
Callbacks are tracked as a signal: a prospect who calls back is routed to the rep who called, with the context of the previous attempt. In our experience that is one of the highest-converting conversations a rep can have.
Twelve metrics, three layers, and the discipline to review by slot rather than by month. If you only add one this week, split your connect rate by hour of the day for the last four weeks. The gap between your best and worst slot is usually larger than the gap between your best and worst rep.