Get started
Still unsure of the impact of Sonik?
See it for yourself and ask for your free trial

We analysed 1,000,000 B2B cold calls across more than 100 industries in 2026. In every one of them, top-quartile SDRs book more than ten times the meetings of the bottom quartile. The gap comes from openers, questions and pace, not from the market. Enter your work email to read the full benchmark.
Connect rates by slot and persona, openers, questions, objections, and what to change on Monday morning.
Professional email only. No spam, one follow-up at most.
We analysed 1,000,000 B2B cold calls across more than 100 industries in 2026 to see what separates calls that book a meeting from calls that do not. The short answer: the market is not the lever. Your openers, your questions and your pace are, and all three can be coached this week.
Sonik analysed one million outbound cold calls placed in 2026 by B2B prospecting teams through the Sonik dialer: transcripts, durations, objections and outcomes. Connect rates and time-slot rates exclude any segment with fewer than 200 calls.
Four numbers frame the rest.
One caveat. The gaps we show are correlations, not proven causes: an interested prospect lets the rep ask more questions, for example. Read them as practices associated with success and test them with your own team.
Top-quartile SDRs book a meeting in 5.5% to 11.8% of conversations. The best rep in the dataset converts at 11.8%. Bottom-quartile SDRs, calling the same markets, sit at 0% to 1%. That is a 10x productivity gap at equal call volume, and it comes from skill and practice, not from the market.
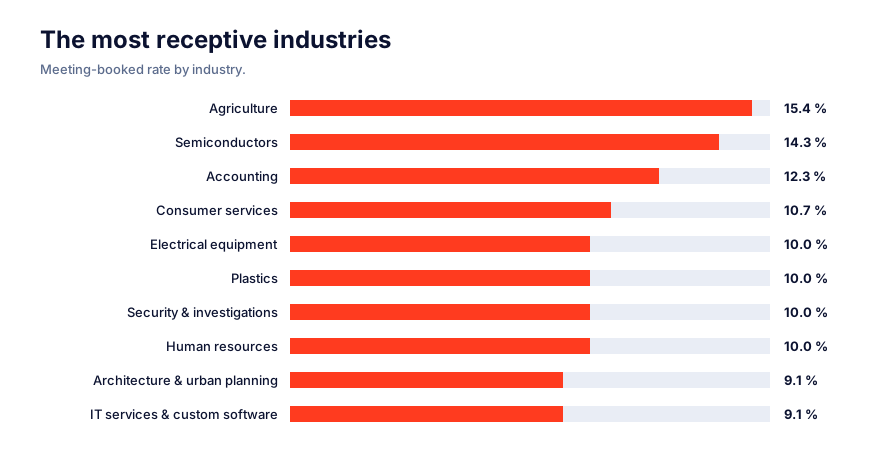
Traditional industries book more meetings than tech: less saturated with prospecting, and their leaders still pick up. Agriculture leads at 15.4%, followed by semiconductors at 14.3% and accounting at 12.3%. IT services and custom software sit at 9.1%.
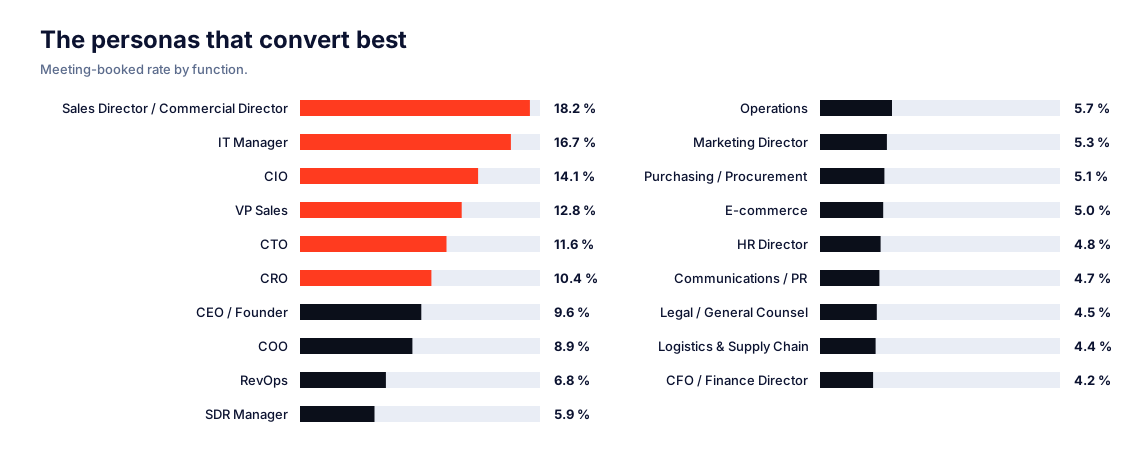
Persona moves the meeting rate far more than industry does. Sales Directors convert at 18.2% and IT Managers at 16.7%, followed by CIOs at 14.1% and VP Sales at 12.8%. Support functions (HR, legal, finance) convert two to four times less.
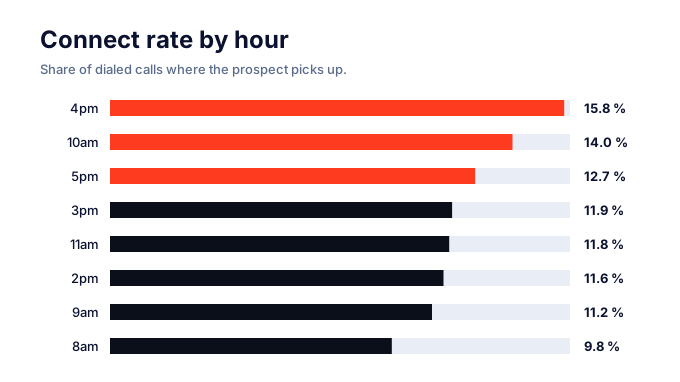
Connect rate shows two peaks. The first is 10am at 14.0%. The second is late afternoon, with 4pm at 15.8% and 5pm at 12.7%. 8am is the weakest slot at 9.8%.
The day of the week behaves differently. Connect rate stays stable from Monday to Friday, but meetings are booked mostly early in the week, and booking collapses on Friday. The day of the call is worth a 1.7x swing in meeting rate, from 2.55% on the worst day to 4.26% on the best.
The overall average connect rate is 11.3%. Sales and Growth contacts pick up at 15.3% and Leadership and Founders at 15.1%. Legal sits at 10.8%, Marketing at 10.7% and Procurement at 9.9%. Technology and IT are at 8.9% and HR at 8.4%.
Industry gaps are narrower, between 9% and 13%. Professional services connect at 13.2%, real estate and construction at 12.6%, technology at 12.0%, and industry and manufacturing at 9.1%.
Note that IT picks up less than almost anyone, yet IT Managers are the second-best persona for booking a meeting once you reach them. Low connect, high conversion.

Cross persona with timing and the connect rate climbs well above the 11.3% average. These are the best combinations we observed.
The effect of persona crossed with timing is far larger than the effect of industry alone.
We sorted every opener into five types and ranked them by meeting-booked rate.
Two-thirds of all calls open with the worst-performing hook. Moving that volume to a trigger or a signal is the single biggest opening lever in the dataset.
The opener sets the structure of the rest of the call. Reference and context calls (trigger, discovery, CTA) are 3% of calls and book 8% to 12%. Personalised discovery is 12% of calls and books 7% to 10%. Discovery with permission is 20% and books 4% to 5%. Quick qualification is 10% and books 3% to 4%. An immediate objection (intro, objection, call ends) is another 10% and books nothing.
Then there is pitch first (intro, pitch, value, qualification, CTA). It is 45% of calls and books 2% to 3%. The open-conversation rate tells the same story: 90% for reference calls, 70% for pitch first. Establishing relevance before explaining the solution is the biggest driver of both the conversation and the meeting.
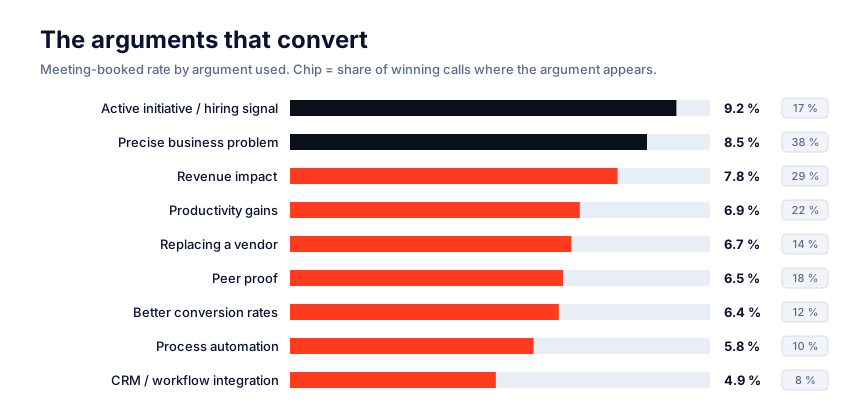
The best calls tie a current business priority to a precise problem and a measurable outcome. They never lead with features. An active initiative or hiring signal books 9.2% and a precise business problem 8.5%. Revenue impact follows at 7.8%, productivity gains at 6.9% and peer proof at 6.5%. CRM and workflow integration closes the ranking at 4.9%.
What resonates also changes with seniority. C-level contacts respond to growth, strategic stakes, ROI and business outcomes. VPs respond to performance, access to decision-makers and revenue impact. Directors and Heads respond to productivity, execution and process efficiency.
The same logic holds by function. Sales leaders care about revenue steering: forecast, pipeline, productivity, hiring. Executive leadership cares about trajectory: growth, efficiency, strategic initiatives. IT leadership cares about execution: workflow, implementation, operational gains. Same offer, three conversations.
Winning calls and losing calls differ on almost every measurable dimension.
Winning calls ask 2.3 times more questions, but they ask them roughly twice as slowly. The call looks less like a pitch and more like a consultation. Question frequency is the clearest differentiator between top and bottom quartile, ahead of talking pace and ahead of the script.
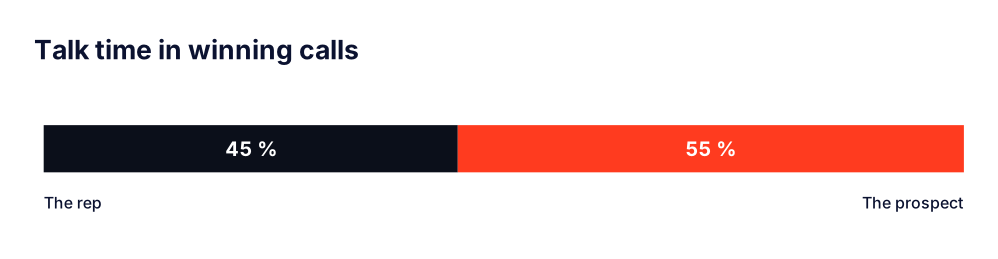
Open questions do the heavy lifting. Asking "How do you handle..." rather than "Do you do..." is 190% more effective.
The best reps earn the meeting and ask later than everyone else. In calls that succeed, the sequence runs in six steps:
The ask sits in fifth position, after discovery. Reps who ask too early collect "send me an email".
Six in ten objections are predictable, so you can rehearse them. The chart shows how often each appears and the meeting rate reps still achieved.
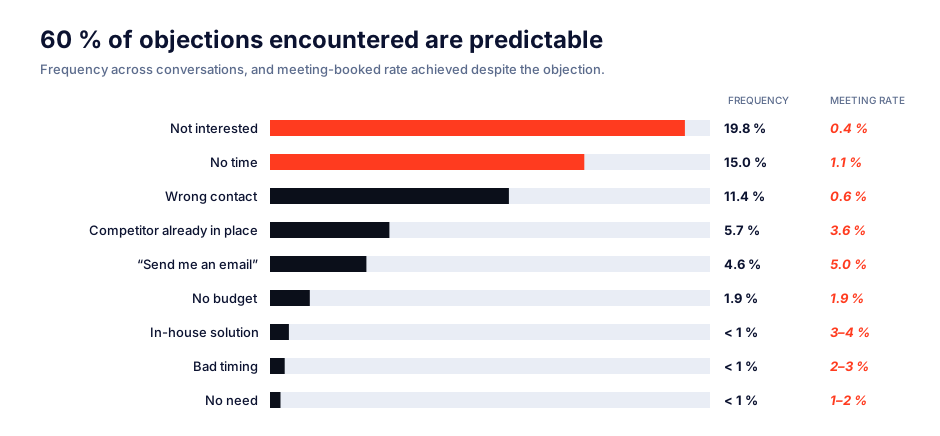
Three readings matter. First, "not interested" dominates at 19.8% of conversations but converts at only 0.4%. "No time" is 15.0% and wrong contact 11.4%. "Send me an email" converts 12.5 times better than "not interested", because it is a soft objection that still leaves a door open. Second, a competitor already in place converts 9 times better than "not interested", at 3.6% against 0.4%. Third, budget is almost a non-issue at 1.9%, and "no budget" still books at 1.9%. The real blocker is relevance.
"Not interested" and "no time" together make up about 35% of objections. Coach those two first, and handle them as a conversation rather than a script. A weak opener such as "this is a sales call" invites the objection before the first question. That is why asking a question first beats defending a pitch.
Time on the phone is strongly linked to the number of conversations (81% correlation) and meetings booked (68%). It has almost no link to the meeting-booked rate (5%) or the connect rate (2%). These percentages measure the strength of the link, not the rates themselves.

You cannot make up for low volume with talent, and you cannot make up for a low rate with volume. Manage them as two separate levers.
The top performers pull both. The top 10% by meetings booked made around 2,000 calls a month at a 10% meeting rate and booked more than 20 meetings. The rest of the team made around 220 calls a month at 4% to 5% and booked fewer than 10. That is 9 times more calls and a conversion rate more than twice as high. The top 10% by conversion converts above 10% at average volume and books 10 to 20 meetings.
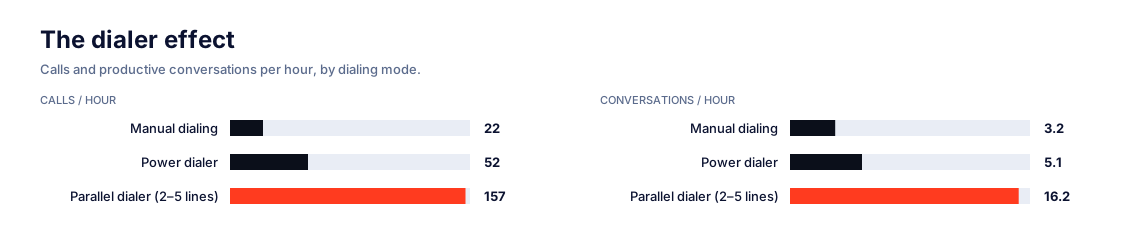
The tool changes the volume side. Here is what we measured by dialing mode.
That is 3 times more live conversations than a power dialer and 5 times more than manual dialing, at constant headcount.
We built Sonik around this finding. The dialer calls several prospects at the same time and skips voicemails, so a rep spends the hour talking instead of waiting. The goal is 5 times more conversations with the right contacts, and signals such as website visits tell the rep who to call first and why.
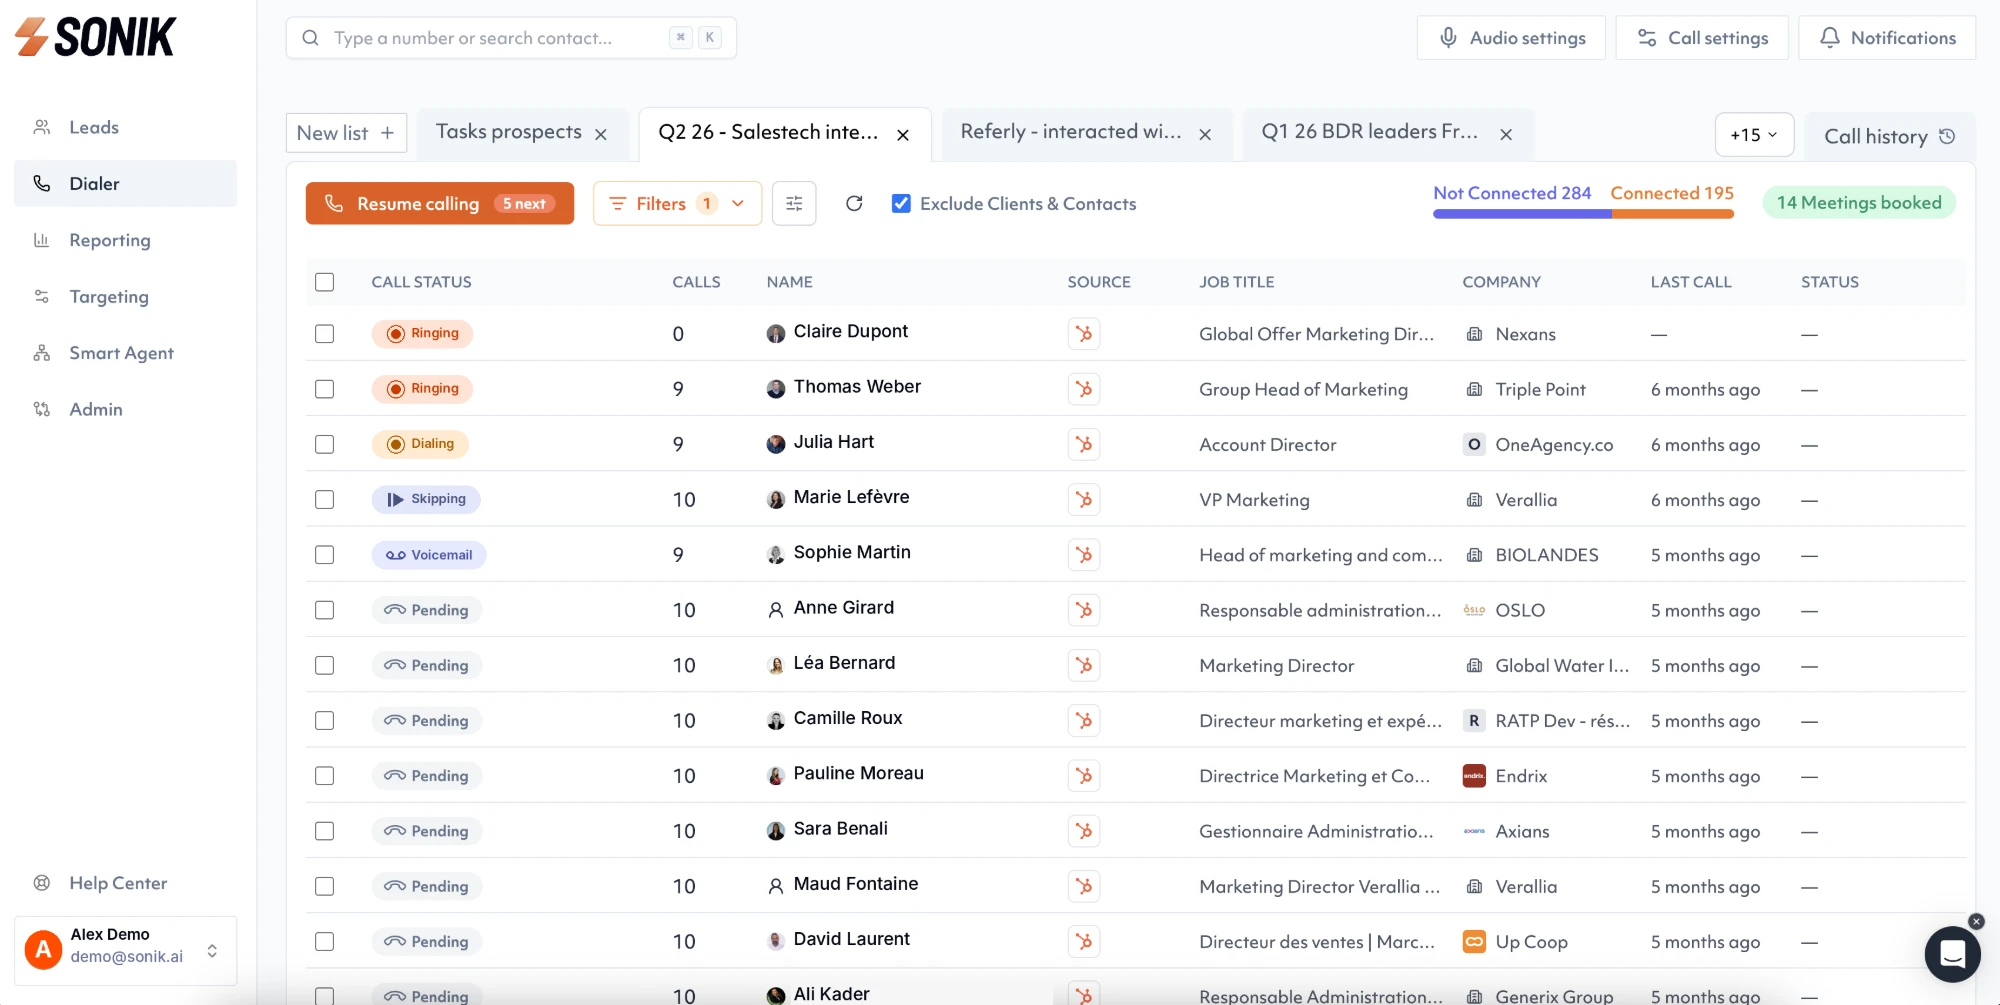
On average, a rep on Sonik makes 127 dials, holds 10 conversations and books 0.66 meetings per hour.
We ranked nine success factors by the gap between bottom and top. Individual skill leads at 10x and is hard to change. Call volume (7x, from 22 to 157 calls per hour), call structure (4x), the first 30 seconds (4x), persona (4.3x, from 4.2% to 18.2%), questions asked (2.3x) and the dialing tool (3x) are all easy to act on. The day of the call and the industry are 1.7x each.
Stacked together, these multipliers explain why two reps on the same market get radically different results. We call it the meeting equation.

These are the top coaching priorities.
Correct these five and the average meeting-booked rate moves from 4.5% to 7.5%. That is 67% more meetings without a single extra call. It is the biggest lever in the dataset.
There is no universal script. Heads of Sales in tech want a personalised observation first, then discovery, value and the ask. Founders and CEOs want the trigger, then the business problem. Recruiters respond to a hiring signal. HR responds to a challenge question. SMB owners tolerate only a short permission, a problem and the ask. Enterprise decision-makers need context and credibility before any proposal. The fundamentals do not change: relevance, curiosity, discovery, value, meeting.
The two best predictors of a booked meeting are time spent on the phone and the rep's ability to turn the first minute into a discovery conversation.
Start today: pull your last 10 calls, count the questions and check how many open with a trigger. To see what a parallel dialer does to your own numbers, look at the Sonik dialer.
This benchmark covers 1,000,000 B2B prospecting calls across more than 100 industries, analysed with the support of artificial-intelligence systems. The data has not been through in-depth consistency checks, so discrepancies cannot be fully ruled out. You may share it free of charge if you credit Sonik as the source. Resale, extraction of a substantial part of the data and text and data mining, including AI training, are not allowed without written consent.